Crest factor: why equal peaks can behave completely differently
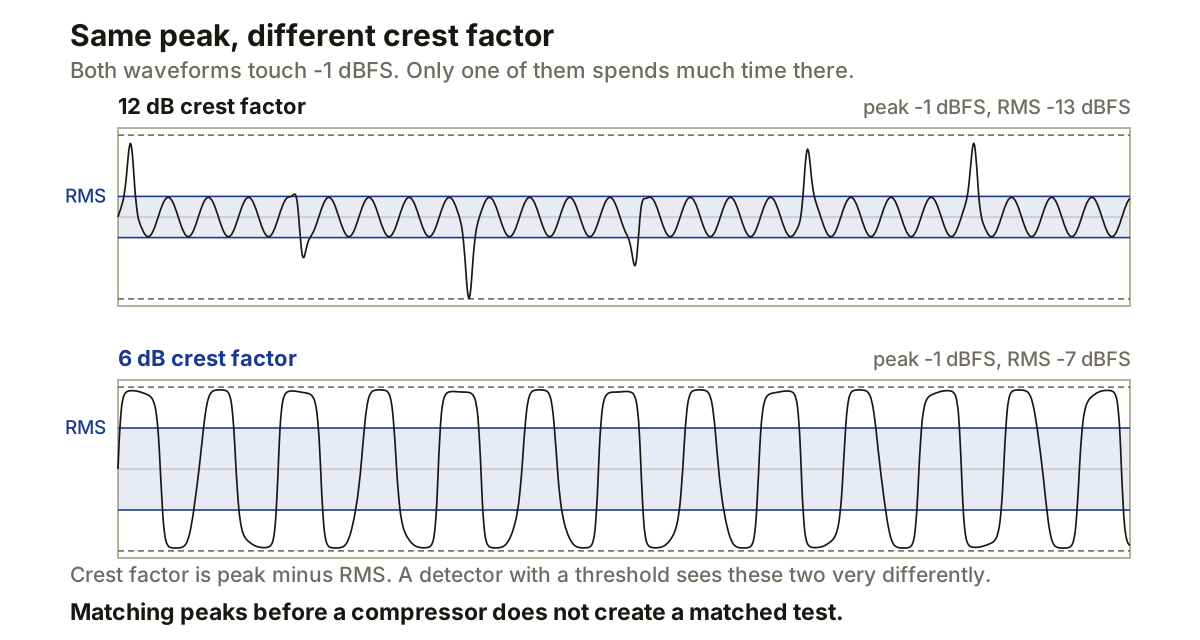
Two signals can both peak at -1 dBFS while placing very different demands on a compressor or limiter. The missing number is crest factor, the ratio between a signal’s highest instantaneous value and its root-mean-square level.
A high crest factor means the peak stands well above the average. A low crest factor means the signal spends more time near its peak. Neither is automatically better. The number describes the waveform over the measured interval.
Peak and RMS answer different questions
A sample-peak meter reports the highest individual sample. It is useful for finding immediate headroom problems, but it says little about how much level surrounds that peak.
RMS squares every sample in a measurement window, finds the mean of those squared values, then takes the square root:
RMS = sqrt((x1^2 + x2^2 + ... + xN^2) / N)
Squaring makes negative and positive samples contribute equally. A brief spike affects the result, but it does not dominate a long window the way it dominates a peak reading.
Crest factor divides the absolute peak by RMS. When both readings are already in decibels, the shorter calculation is simply peak minus RMS:
crest_factor_dB = peak_dB - RMS_dB
A signal peaking at -1 dBFS with an RMS level of -13 dBFS therefore has a crest factor of 12 dB. Another signal with the same peak reading -7 dBFS RMS has a crest factor of 6 dB.
A sine wave gives the reference case
For a sine wave with a peak amplitude of 1, the RMS value is 1 / sqrt(2), or about 0.7071:
crest ratio = 1 / 0.7071 = 1.414
20 * log10(1.414) = 3.01 dB
National Instruments gives the same reference values: 1.414 for a sine wave and 1 for a half-duty square wave. The square wave reaches its peak for the whole active cycle, so its RMS equals its peak and its crest factor is 0 dB.
Recorded music does not hold one fixed waveform, so its crest factor moves from moment to moment. A drum hit produces a brief high peak above a quieter body. Sustained distortion keeps many samples closer to the peak. The useful comparison is between the same section before and after processing, measured with the same settings.
The measurement window changes the answer
RMS requires a time window. A short window follows level changes closely. A longer window averages more of the surrounding signal, so one transient contributes less.
This means RMS readings from different meters are not guaranteed to match. Window length and weighting can differ, as can channel handling. Apple exposes the relationship directly in Multipressor: its Response control moves from 0 ms peak detection towards RMS measurement at 200 ms, with 100 ms given as a general starting point.
Silence also changes the result. Measure one snare hit in a two-second selection and the RMS level includes the space around it. Crop the selection tightly and RMS rises even though the hit has not changed. For repeatable comparisons, use the same region boundaries and the same meter.
Why compressors react differently
A peak detector responds to short excursions. An RMS detector responds to the level averaged across its window. Ableton documents this distinction in Compressor: Peak mode reacts to brief peaks, while RMS mode is less sensitive to them and waits for the input to remain above threshold longer.
Take the two signals above. Both reach -1 dBFS, but one has 12 dB of crest factor and the other 6 dB. With a peak detector and a threshold of -4 dBFS, both can trigger gain reduction at their highest point. With an RMS detector and the same numerical threshold, the denser signal is far more likely to stay above threshold, because its average level is 6 dB higher.
Attack and release still determine how the gain envelope moves, so crest factor does not predict exact gain reduction without those settings and the detector design. What it explains is why matching peaks before a compressor does not create a matched test.
What clipping and limiting change
A clipper reduces peaks that cross its boundary. If RMS stays nearly fixed while the peak falls, crest factor falls by the same amount. A 2 dB peak reduction with no RMS change turns 12 dB of crest factor into 10 dB.
Real processing often changes both values. Added harmonics alter RMS, and output gain moves peak and RMS together. This is why the calculation should use measurements from the rendered result rather than the control labels.
A limiter ceiling tells you the maximum allowed output peak. It does not state how much gain reduction is required to raise the body of the signal towards that ceiling. Material with occasional high peaks needs those events reduced before its RMS can rise. Material with a lower crest factor is already spending more time near the ceiling.
Measure it without fooling yourself
Choose a representative section and remove leading or trailing silence from the measurement. Read peak and RMS at the same point in the signal path, then subtract. Process the section, match its output peak to the original, and measure again.
If the peak stays at -1 dBFS while RMS moves from -13 to -10 dBFS, crest factor has fallen from 12 to 9 dB. The waveform now has 3 dB less separation between its peak and average levels. Whether that suits the record is a separate decision, and one that needs the full mix at matched playback level.
Producer’s note
Loop the same eight bars for every crest-factor check and reset the peak hold before each pass.
If the meter reads -1 dBFS peak and -13 dBFS RMS, write down 12 dB. After processing, match the peak back to -1 dBFS. An RMS reading of -11 dBFS then shows the processing reduced crest factor by 2 dB, with no louder peak disguising the comparison. Without that peak match you are reading two numbers that both moved, and neither of them tells you what the processor did to the shape.